Smart Column Chart
The SDM Smart Column Chart is a versatile bar/column chart visual for Power BI that supports six rendering modes, intelligent data label placement, analytics overlays, error bars, an Add. Table of extra values beside the marks, and up to three significance tests.
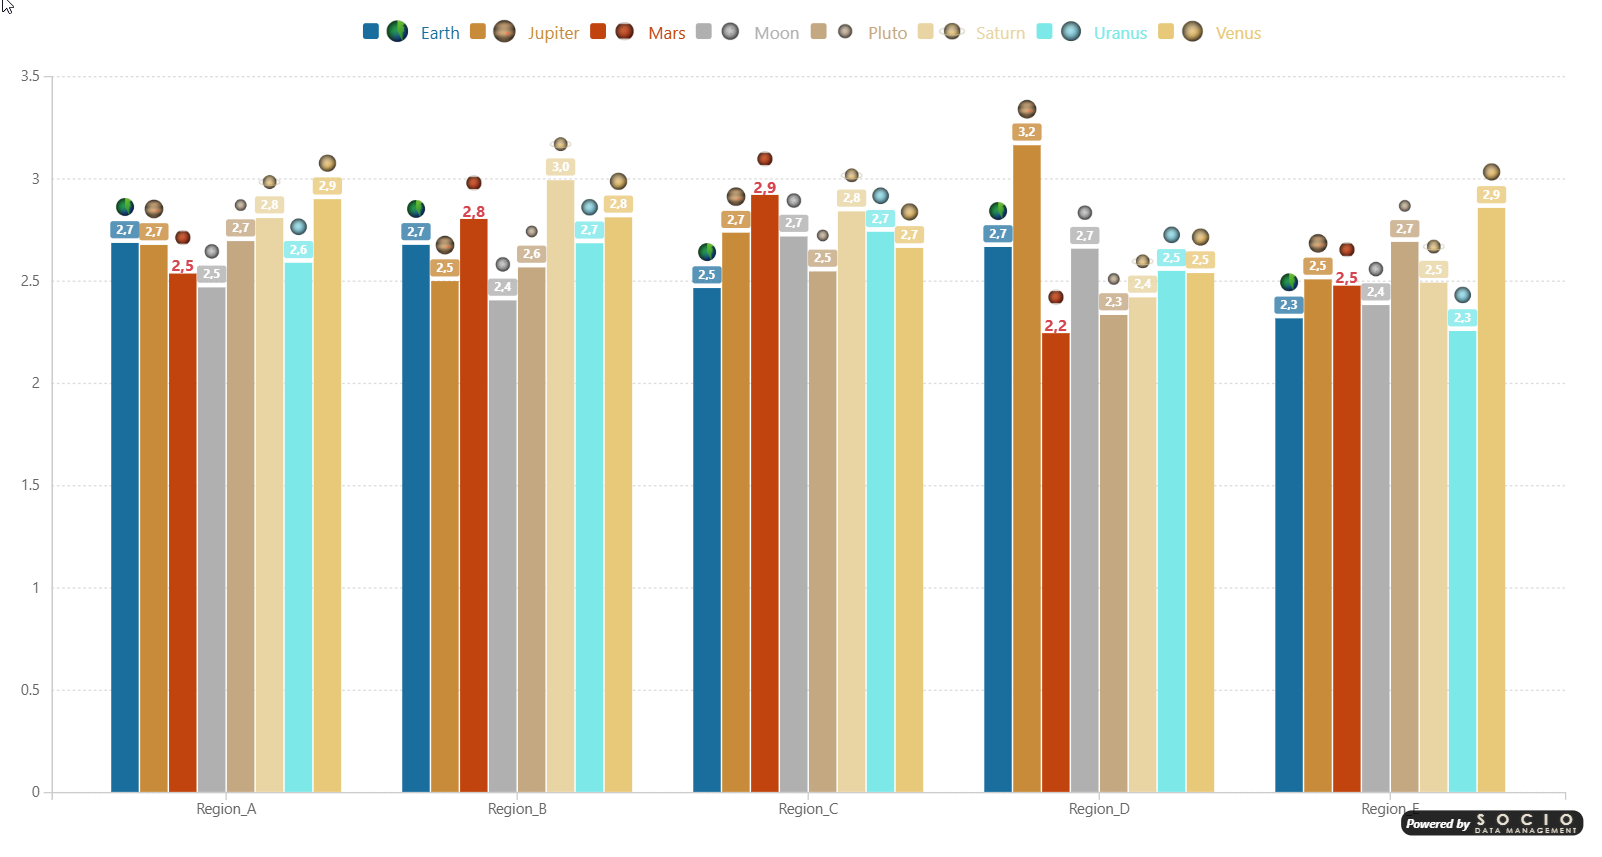
Chart Types
| Mode | Description |
|---|---|
| Column | Vertical grouped bars — categories on X axis, values on Y axis |
| Bar | Horizontal grouped bars — categories on Y axis, values on X axis |
| Stacked Column | Vertical stacked bars |
| Stacked Bar | Horizontal stacked bars |
| 100% Stacked Column | Vertical stacked bars normalized to 100% |
| 100% Stacked Bar | Horizontal stacked bars normalized to 100% |
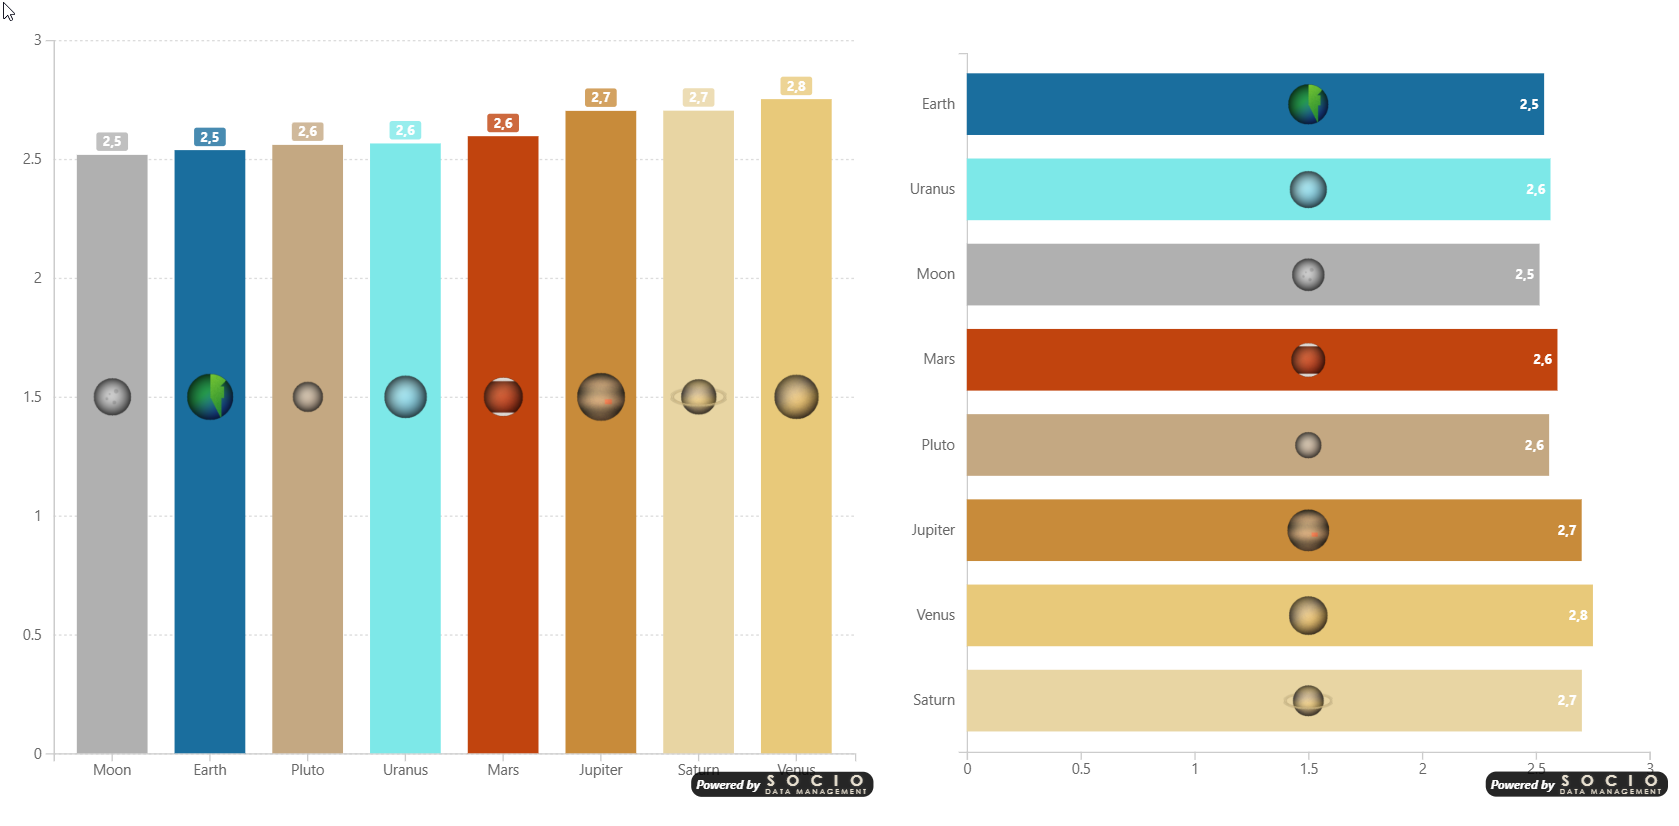
Data Wells
- Axis — One or more categorical fields for bar grouping. Adding multiple fields creates a multi-level hierarchy axis with drill-down support.
- Values — One or more measures displayed as bars
- Legend — Grouping field to split bars into colored series
- Series Color — Hex color codes per series
- Logo — Base64 images per series
- Error Bar Upper/Lower — Measures for error bar bounds
- Add. Table — Measures shown as extra cells beside the marks — columns beside the bars, rows under or over the columns — with per-field formatting, row / column box, logos and warning / critical thresholds
- Base (sample size) — n of the significance tests
- Standard Deviation — switches the significance tests from proportions to means
- Significance reference — measures returning the reference of an External reference test, as JSON
Multi-Level Axis & Drill-Down
When two or more fields are placed in the Axis well, the visual activates Power BI's drill-down icon in the visual header and renders a hierarchical axis:
- Drill down / Drill up — Navigate one level at a time
- Expand all — Show all levels simultaneously, with bracketed group labels and optional separator lines below the axis
See Multi-Level Axis for full details and formatting options.
Selection & Cross-Filtering
Clicking on bars cross-filters other visuals on the report page.
| Action | Behavior |
|---|---|
| Click a bar | Selects that single data point |
| Ctrl+Click (Cmd+Click on Mac) | Adds or removes individual bars from the selection |
| Alt+Click a bar | Selects all bars of the same series (Legend value) across every category |
| Click empty area | Clears the selection |
Alt+Click is only available when a Legend field is assigned. It is useful for cross-filtering an entire series at once rather than selecting bars one by one.