Smart Line Chart
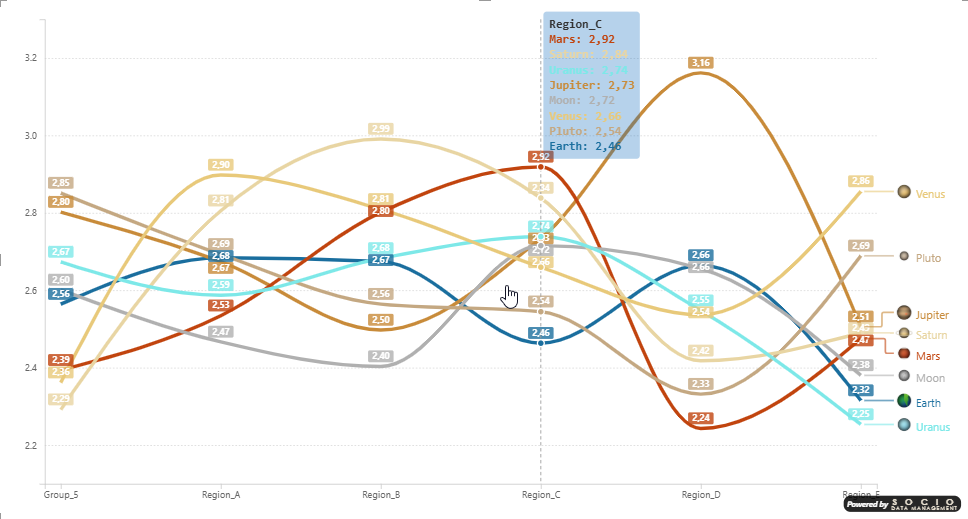
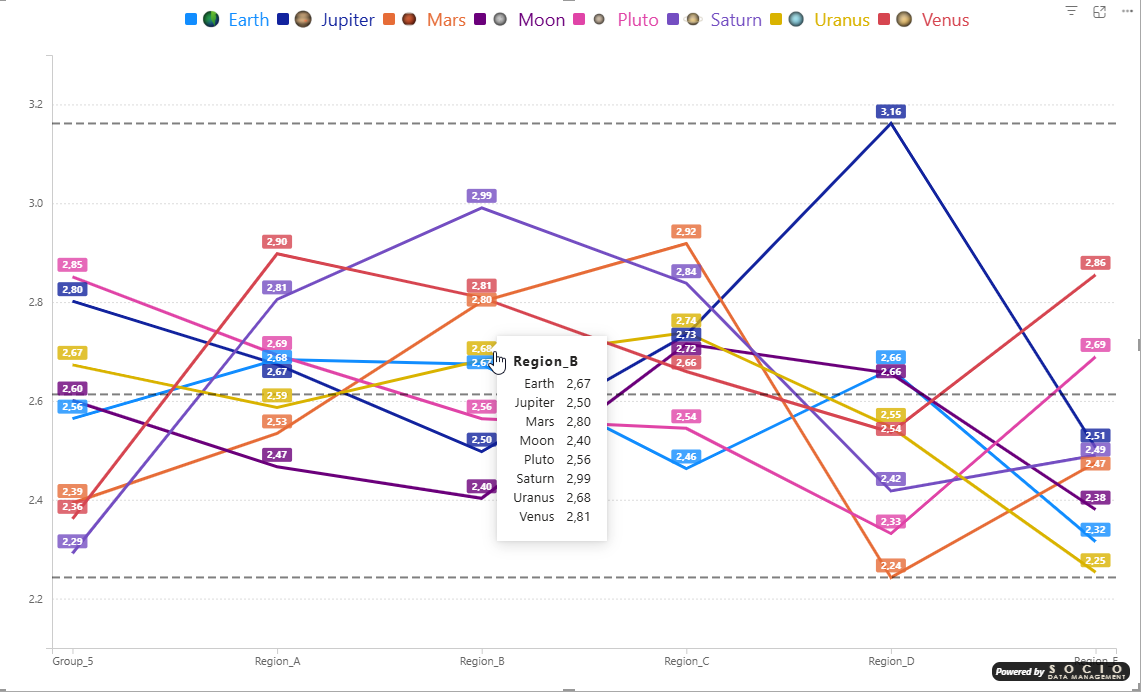
The SDM Smart Line Chart renders multi-series line charts with advanced features including end-of-line labels, configurable markers, analytics overlays, and error bars.
Key Features
- Line styles: Solid, Dashed, Dotted
- Curve types: Linear, Monotone, Step
- Markers: Per-series shape, size, and color via the "Apply settings to" dropdown
- End-of-line labels: Automatic overlap prevention with lead lines
- Data labels: Per-series formatting with smart positioning
- Analytics pane: Reference lines, error bars, average curves
- Y Axis range: Manual min/max override with partial auto-completion
- Significance testing: Up to two statistical tests, with icon, border, background or marker decorations
- Base row: Sample size per category displayed under the X axis
- Cartouche: Free text overlay anchored to one of six positions, bindable to a measure
Data Wells
| Data Role | Description |
|---|---|
| Axis | Category axis (X axis) |
| Values | Measure values (Y axis) |
| Legend | Split into multiple series |
| Series Color | Hex color per series |
| Logo | Base64 image per series |
| Error Bar Upper/Lower | Error bar bounds |
| Base (sample size) | Sample size per category — enables the base row and significance testing |
| Standard Deviation | Standard deviation per point — switches significance to a mean test |
