SDM Smart Graph Visuals
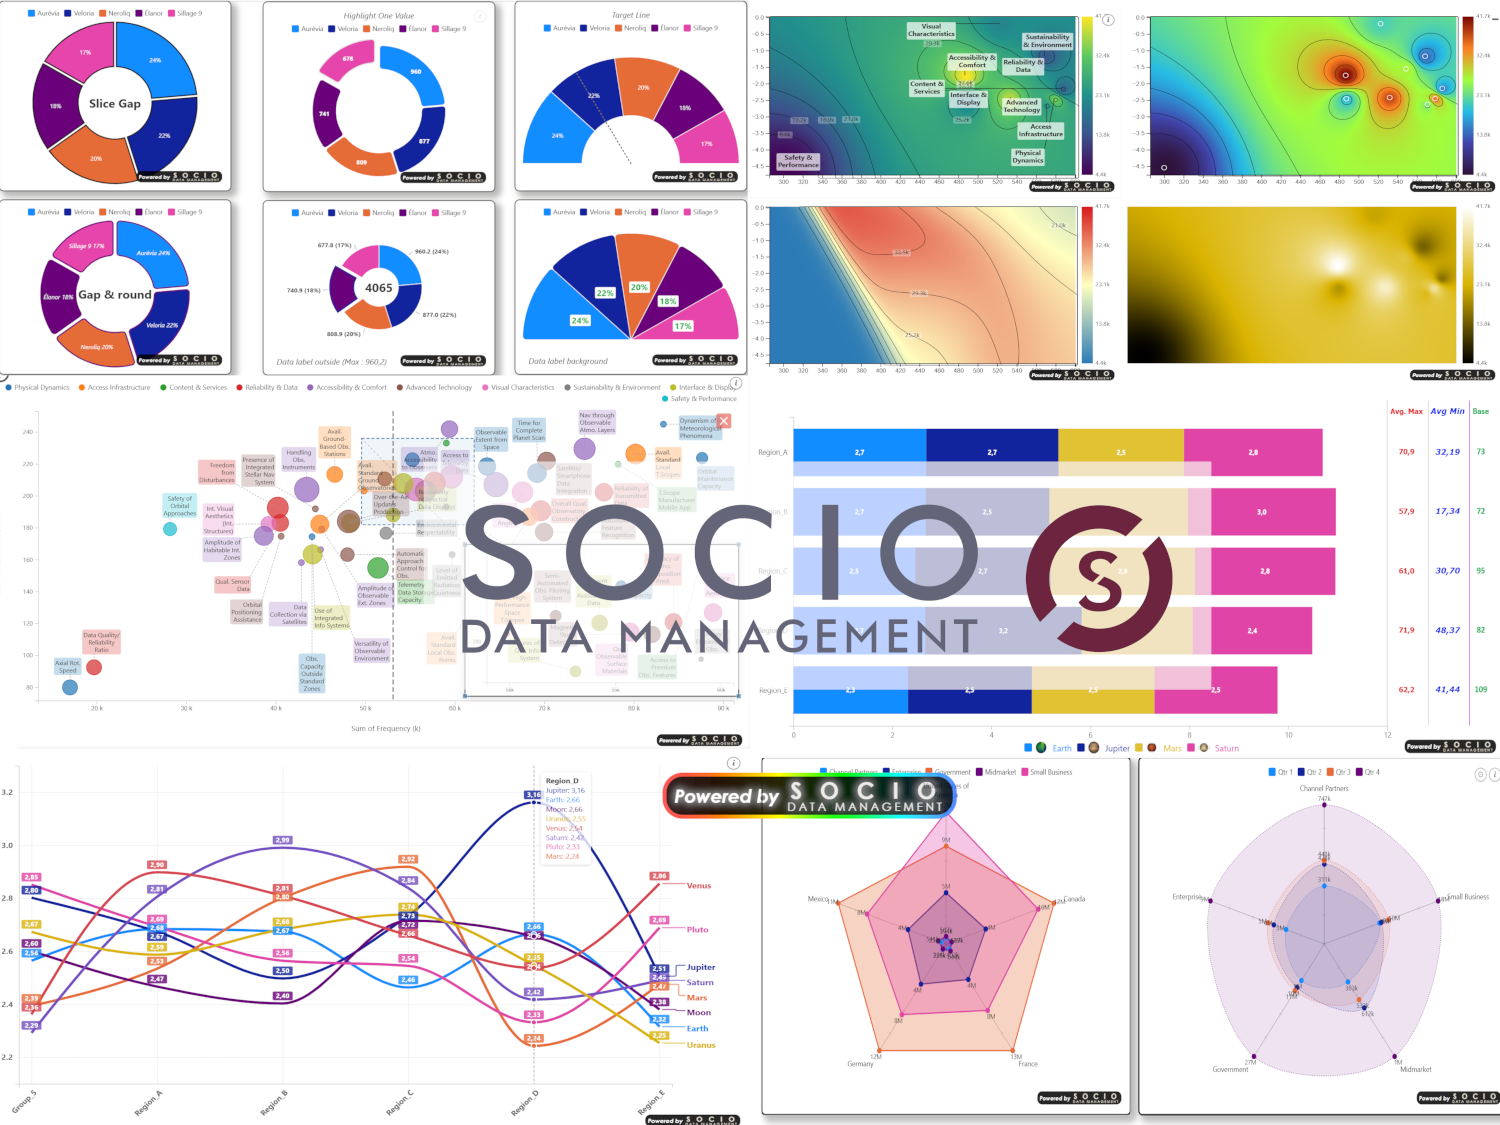
The SDM Smart Graph Visuals suite provides six professional-grade chart visuals for Power BI:
- Smart Column Chart — Grouped and stacked column/bar charts
- Smart Line Chart — Multi-series line charts with end-of-line labels
- Smart Scatter Plot — XY scatter plots with size encoding and zoom insets
- Gradient Heatmap — Continuous heat surfaces interpolated from scattered sample points
- Smart Radar — Spider webs over n axes, each carrying its own scale
- Smart Pie Chart — Pies, donuts and half-circle gauges, as small multiples or concentric rings
Key Features
All six visuals share a common foundation — the About dialog, the Global Threshold panel, the licensing card, native tooltips and cross-filtering. Beyond that, each visual carries the features that make sense for its own shape:
| Feature | Column | Line | Scatter | Heatmap | Radar | Pie |
|---|---|---|---|---|---|---|
| Data-driven series colors | Yes | Yes | Yes | — | Yes | Yes |
| Series logos in legend | Yes | Yes | Yes | — | Yes | Yes |
| Configurable data labels | Yes | Yes | Yes | — | Yes | Yes |
| Per-series label visibility | Yes | Yes | — | — | — | — |
| Analytics pane (reference lines) | Yes | Yes | Yes | — | — | — |
| Error bars | Yes | Yes | — | — | — | — |
| Significance testing (up to 3 tests, external reference) | Yes | Yes | — | — | Yes | Yes |
| Add. Table (extra rows / columns of values) | Yes | Yes | — | — | — | — |
| Small multiples | — | — | — | — | — | Yes |
| Cross-filtering | Yes | Yes | Yes | Yes | Yes | Yes |
| Custom & native tooltips | Yes | Yes | Yes | Yes | Native only | Yes |
| Value formatting (source format) | Yes | Yes | Yes | Yes | Yes | Yes |
| Global Threshold panel | Yes | Yes | Yes | Yes | Yes | Yes |
| Conditional (base) threshold | Yes | Yes | Yes | Yes | Yes | Yes |
| Note caption card | Yes | Yes | Yes | Yes | Yes | Yes |
| Add. Table columns & thresholds | Yes | — | — | — | — | — |
| Localization | 10 languages | 10 | 10 | 10 | 10 | 10 |
| Licensing & watermark | Yes | Yes | Yes | Yes | Yes | Yes |
The heatmap labels its sample points with the category name rather than with a value, which is why it carries no data-label card of its own — see Category Labels.
Editions
| Feature | Free | Pro | Enterprise |
|---|---|---|---|
| All chart types | Yes | Yes | Yes |
| Data labels | Yes | Yes | Yes |
| Analytics pane | Yes | Yes | Yes |
| Error bars | Yes | Yes | Yes |
| Watermark | Shown | Hidden | Hidden |
| Support | Community | Priority |
Supported Languages
Arabic (ar-SA), German (de-DE), English (en-US), Spanish (es-ES), French (fr-FR), Hebrew (he-IL), Italian (it-IT), Portuguese (pt-PT), Romanian (ro-RO), Chinese (zh-CN).
Every visual ships the same ten locales.