Sample Points
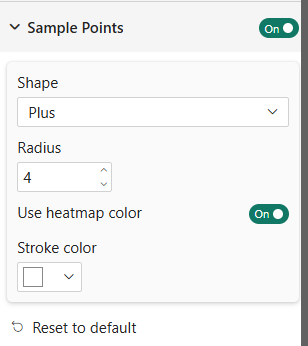
The Sample Points card controls the markers drawn at each original data point — the actual measurements from which the heatmap surface is interpolated.
Visibility
| Property | Description | Default |
|---|---|---|
| Show | Show or hide all sample point markers | On |
Shape and Size
| Property | Description | Default |
|---|---|---|
| Shape | Marker geometry: Circle, Square, Triangle, Diamond, Cross, Plus | Circle |
| Radius | Marker radius in pixels | 3 px |
Colors
| Property | Description | Default |
|---|---|---|
| Use Heatmap Color | Fill each marker with the interpolated heatmap color at its position, so it blends seamlessly with the surface | On |
| Color | Fixed fill color used when Use Heatmap Color is off (hidden when Use Heatmap Color is on) | #222222 |
| Stroke Color | Outline color drawn around each marker | #333333 |


Visibility on dense surfaces
When the heatmap surface is dense and saturated, markers with Use Heatmap Color on can be hard to spot. Disable it and choose a contrasting Color (e.g., white or black) to make sample locations clearly visible.
Interactivity
Sample points support full Power BI cross-filtering:
- Click a marker to select it and filter other visuals in the report
- Ctrl + Click (or Cmd + Click on macOS) to add to an existing selection
- Right-click to open the Power BI context menu
- Selected points stay at full opacity; unselected points are dimmed when a filter is active
- Hover to display a tooltip with X, Y, Value, Category, and any custom Tooltips measures